
How to read Threads leaderboards and platform data
Nothing in the Data section uses credits. How many entries you can see, the time ranges and the sort options depend on your plan. The Free plan shows less, and you’ll see an upgrade prompt when you reach the limit.
Leaderboards
Section titled “Leaderboards”The Leaderboards page has four tabs:
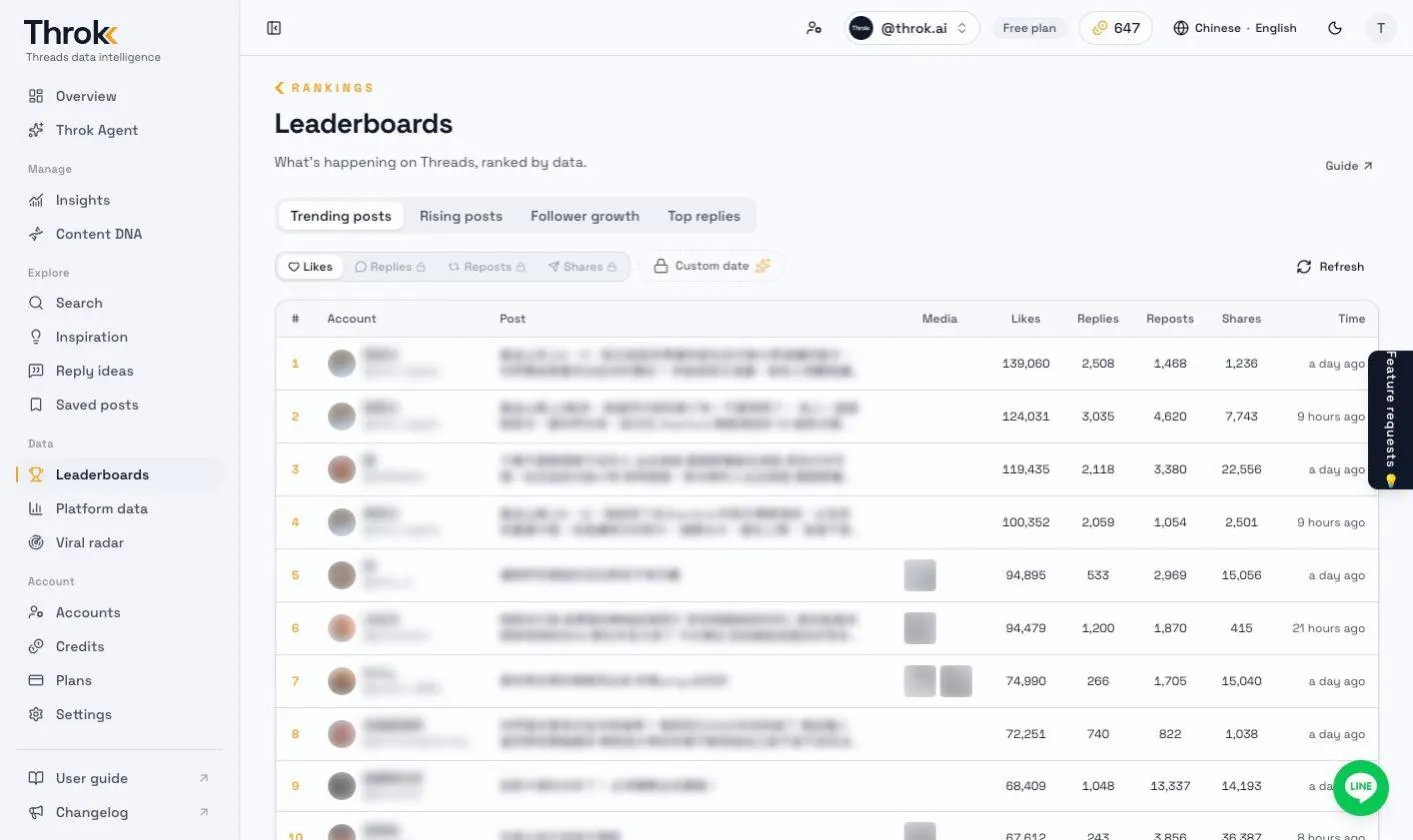
| Tab | What it shows | Options |
|---|---|---|
| Trending posts | Posts with the most engagement over a period | Sort by likes, replies, reposts or shares. Pick a past date |
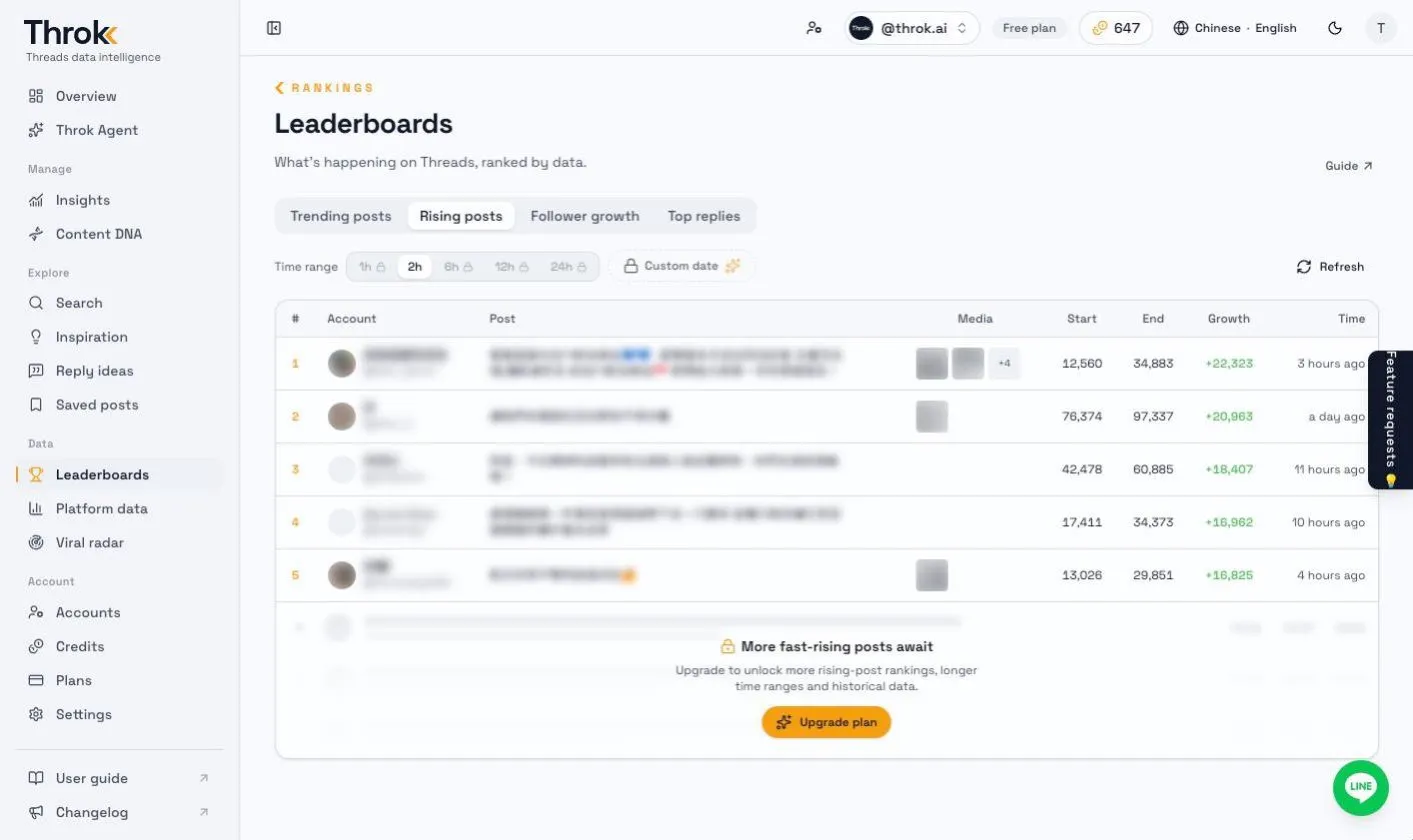
| Rising posts | Posts whose likes are growing fastest | Time range of 1, 2, 6, 12 or 24 hours. Pick a past date |
| Follower growth | Accounts gaining followers fastest | Time range of 1, 3, 7, 14 or 30 days |
| Top replies | Replies that beat the original post. It’s not a plain sort by likes: the more likes the reply has and the fewer the original post has, the higher it ranks | Last 24 hours by default. Pick a past date |
- Some sort options, longer time ranges and past dates require a paid plan.
- We keep tuning how each leaderboard ranks posts so it better reflects what’s hot on the platform.
Viral radar
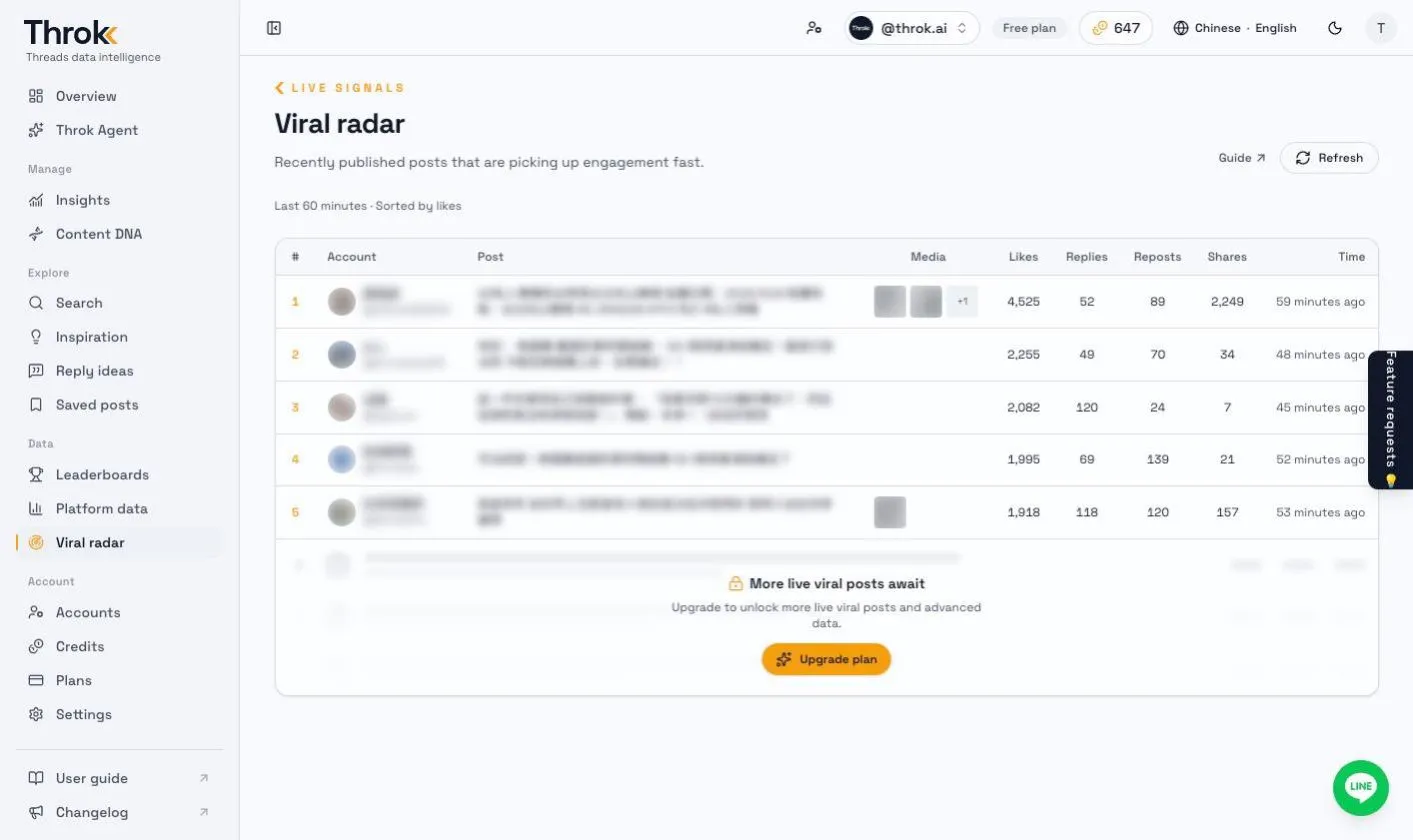
Section titled “Viral radar”Viral radar lists the most-liked posts published in the last 60 minutes, so you can spot content as it takes off. Click Refresh for the latest rankings. The Overview page also shows the top few.
Platform data
Section titled “Platform data”The Platform data page has three tabs:
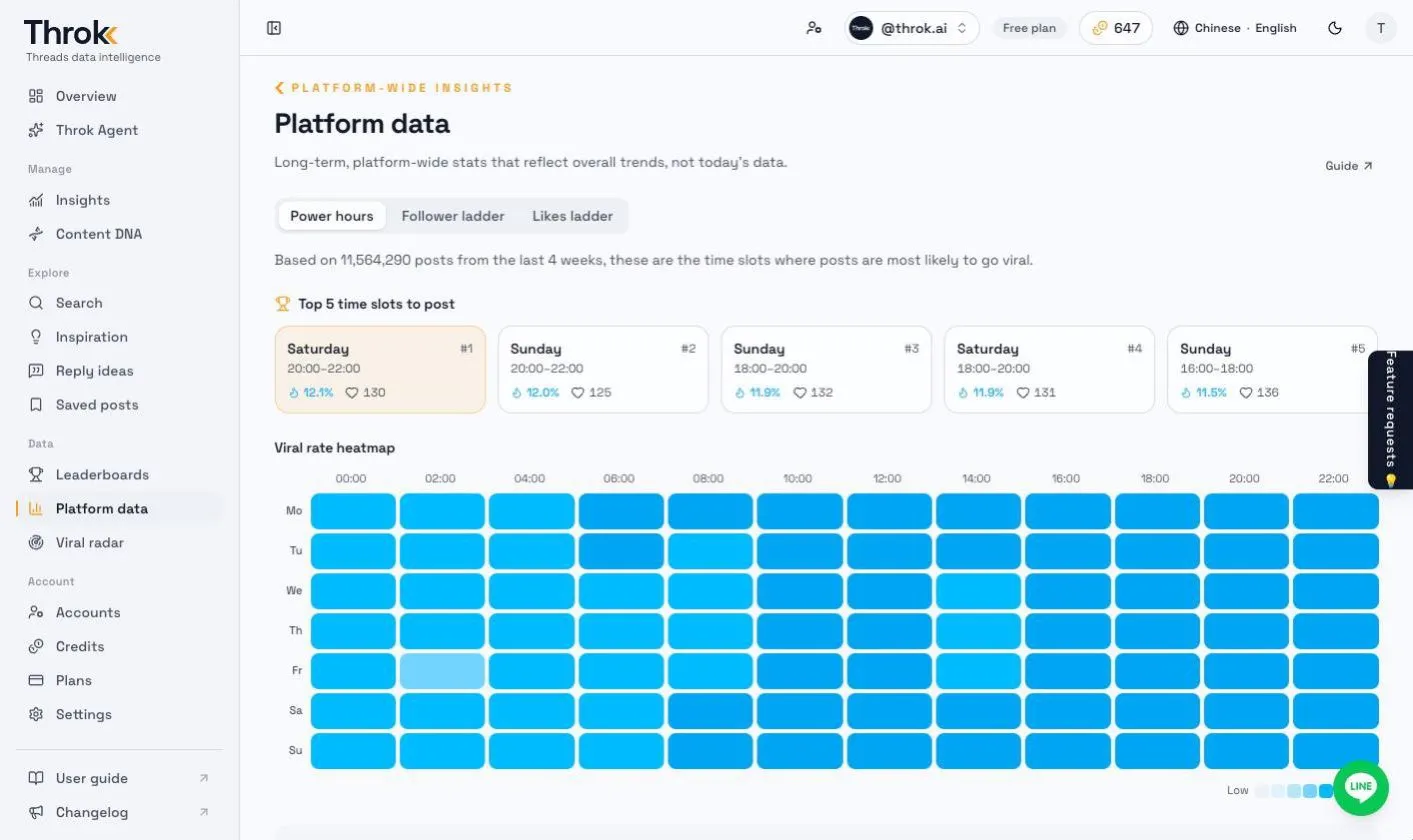
- Power hours: Based on the last 4 weeks of data, a heatmap shows how often posts published in each time slot become trending posts, and lists the 5 best times to post. Follows the post language selected in the header.
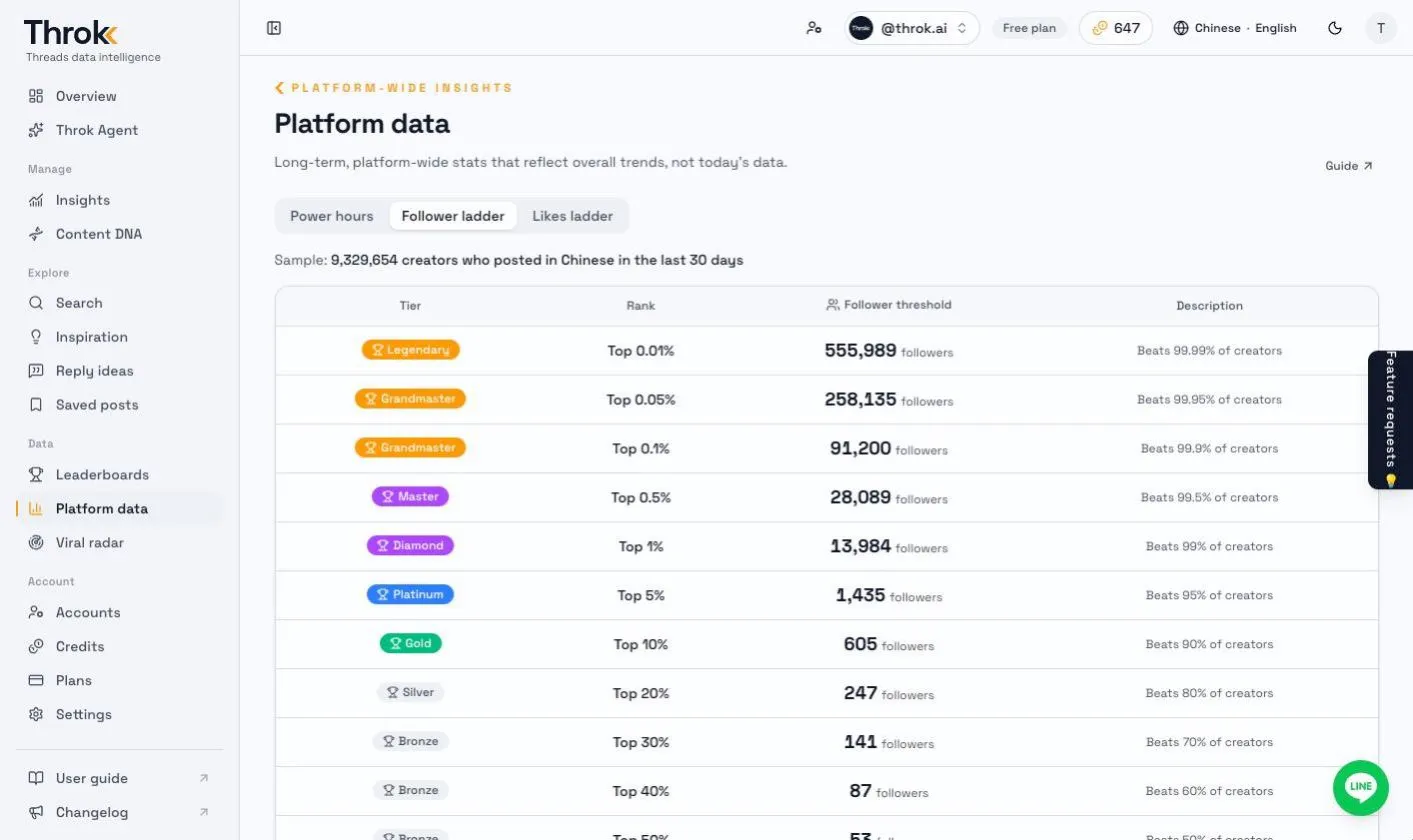
- Follower ladder: Where each follower range ranks on the platform. See which tier your account is in.
- Likes ladder: Like-count thresholds for each tier, so you can tell whether a post is doing well for the platform.
For an introduction to each data view, see Threads leaderboards and data analytics.